Graphing Linear Equations: A Visual Journey
18th Mar 2024
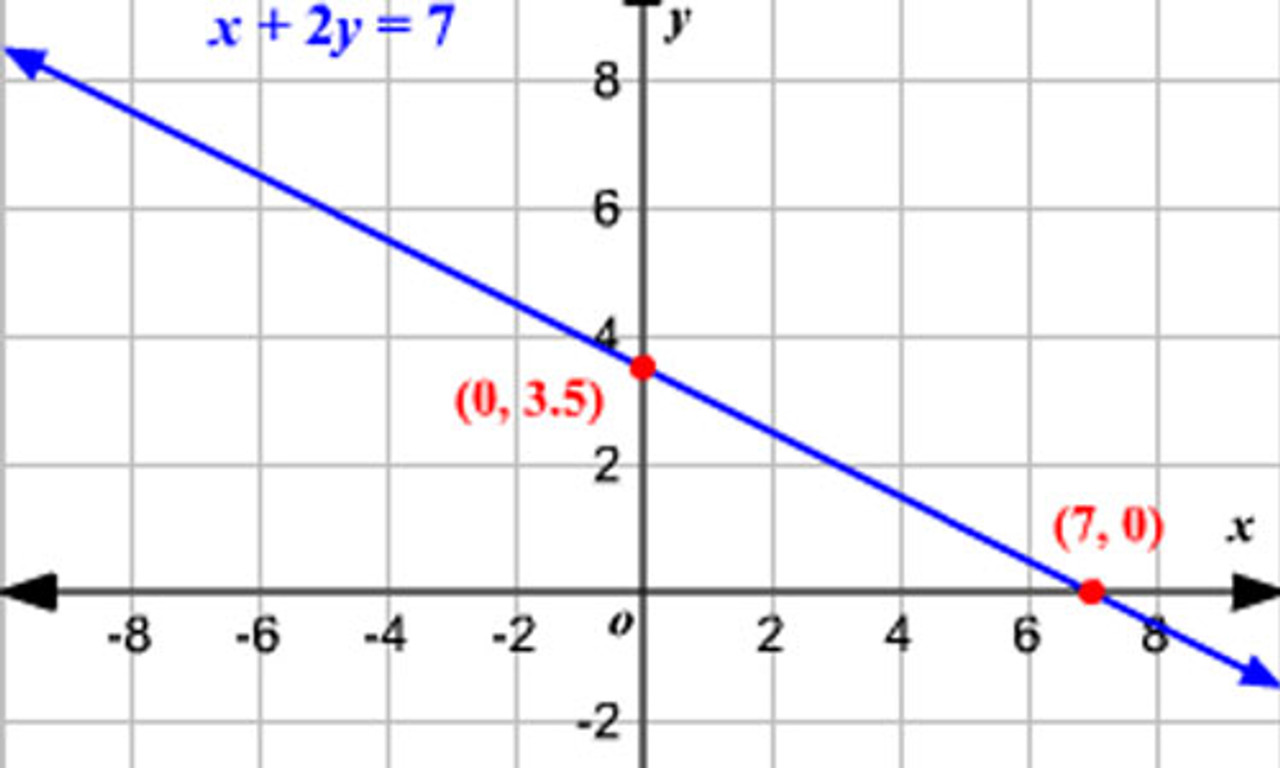
Graphing linear equations is like painting a picture for mathematicians. It allows us to visually express relationships between two variables, making complex concepts more accessible. Whether you’re a teacher, student, or parent, understanding graphing techniques can enhance your mathematical journey. Let’s dive into the world of graphing!
Why Graph Linear Equations?
Graphs provide clarity. Imagine we’re graphing two linear equations:
- (y = 3x - 1)
- (y = \frac{1}{2}x - 1)
The images below illustrate their relationships:
!Graph 1 !Graph 2
Here's what we observed:
- As we move right on the graph, the (x) value increases.
- If the line moves up, the (y) value increases; if it moves down, the (y) value decreases.
- The intersection point (0, -1) represents the solution both equations share.
Graphing Techniques
1. Using Slope and Y-Intercept
The slope-intercept form (y = mx + b) is ideal for graphing. Let’s graph (y = 3x - 1):
- Start at the y-intercept (-1).
- Use the slope (3) to find another point (e.g., move 1 unit right and 3 units up).
- Connect the points to create the line.
2. Using Two Points
Choose any two points on the line. For example:
- Point A: (0, -1)
- Point B: (2, 5)
Plot these points and connect them to form the line.
3. Using Intercepts
Find the x-intercept (where (y = 0)) and y-intercept (where (x = 0)). For (y = 3x - 1):
- X-intercept: Set (y = 0), solve for (x): (0 = 3x - 1), (x = \frac{1}{3})
- Y-intercept: (y = -1)
4. Using Transformations
Apply transformations to basic graphs. For example, shift the line horizontally or vertically.
Real-World Applications
Graphs aren't just theoretical—they're practical tools:
- Video Game Design: Creating models for game environments.
- Data Visualization: Representing data trends.
- Business Analysis: Analyzing profit and loss.
Online Tools for Graphing
- Desmos: User-friendly graphing calculator.
- GeoGebra: Interactive math software.
- Meta-calculator: Graphing and solving equations.
Remember, graphing helps mathematicians explore relationships, compare graphs, and find solutions. So grab your virtual paintbrush and start graphing! ??
References:
- Albert: Graphing with Linear Equations
- Geyer Instructional: Graphing Examples
- Desmos
- GeoGebra
- Meta-calculator

